
Violence Reduction Dashboard

The Violence Reduction Dashboard (VRD) is a publicly available visualization and analysis tool that provides greater transparency and accessibility to near-real-time violent crime data in the city of Chicago.
Challenge
In a large city in which the state of public safety is always evolving, the lack of accessible, detailed, up-to-date data on violence in Chicago left community stakeholders without easy avenues of analyzing current trends, identifying promising solutions, or targeting their services.
Opportunity
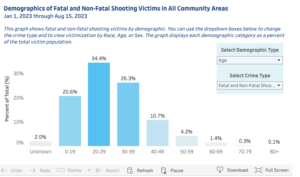
The Crime Lab developed a first-of-its-kind comprehensive data dashboard that allows unfettered public access to city violence data trends categorizable by victim type, date, and geographic area. The VRD allows community-based violence prevention advocates, city agencies, service providers, and the media to be able to quickly distribute necessary resources directly to the communities with the highest need of preventative support, adjust their strategy quickly in response to the latest trends, and hold the public sector accountable.
Project overview
For the non-governmental organizations (NGOs) that operate in Chicago doing violence prevention work, the scale of the city can be a challenge. Chicago spans over 200 square miles and is home to 2.7 million people. Each service area is itself approximately the size of a small to mid-size city, which complicates efforts to serve communities efficiently and effectively. In recent periods of high violence, such as 2016, NGOs were left without easy avenues to make informed service delivery decisions to support those most impacted by gun violence.
Easily accessible, up-to-date data about crime trends is an essential tool for these NGOs to be able to prioritize violence prevention resources for the communities that need them most. Equally crucial is the ability to gather relevant insights quickly without expending bandwidth on extensive data analysis—a need shared by community groups and media stakeholders working to hold the City accountable and identify new, promising solutions to address violence.
Year Started
2017
Topics
Project Leads
David Leitson
Senior Policy Analyst

Jacob Miller
Embedded Analyst

Kim Smith
Director of Programs


Economic Club of Chicago- Chicago’s Safety Snapshot: Issues and Opportunities
These slides were presented by the Crime Lab at a forum hosted by the Economic Club and Commercial Club of Chicago.
Violence Reduction Dashboard
Webinar: Overview of the City of Chicago’s Violence Reduction Dashboard
Launched in May 2021 by the City of Chicago, with design and technical support from the Crime Lab, the Dashboard is a first-of-its-kind comprehensive tool that allows unfettered public access to city violence trends categorizable by victim type, date, and geographic area.

Machine Learning Can Predict Shooting Victimization Well Enough To Help Prevent It
This National Bureau of Economic Research Working Paper shows that shootings are predictable enough to be preventable.
In response to these challenges, the Crime Lab created the Violence Reduction Dashboard in 2017 and then launched it publicly in May 2021. Our team of data scientists and analysts provided the technical expertise to help design the tool, working closely with those leading the work at the City and incorporating critical input from dozens of community organizations, victim services providers, advocates, and city department officials to create digestible, interactive visualizations illustrating current and historic trends of violence. The dashboard also provides access to the underlying data itself for those who want a deeper look.